Due to my previous belief in not putting all my eggs in one basket, and the fact that it was more cost-effective for merchants to sell some annual payment machines, I kept buying chicks and had more than twenty machines at most. All the machines had good performance. In the past, I basically didn't give the chicks any shots, and I was too lazy to aggregate them together for management even if I had a dozen or so in my hand. I didn't think it was of much use, at most, I would run a program on this server, hang a domain name, and set up monitoring alerts.
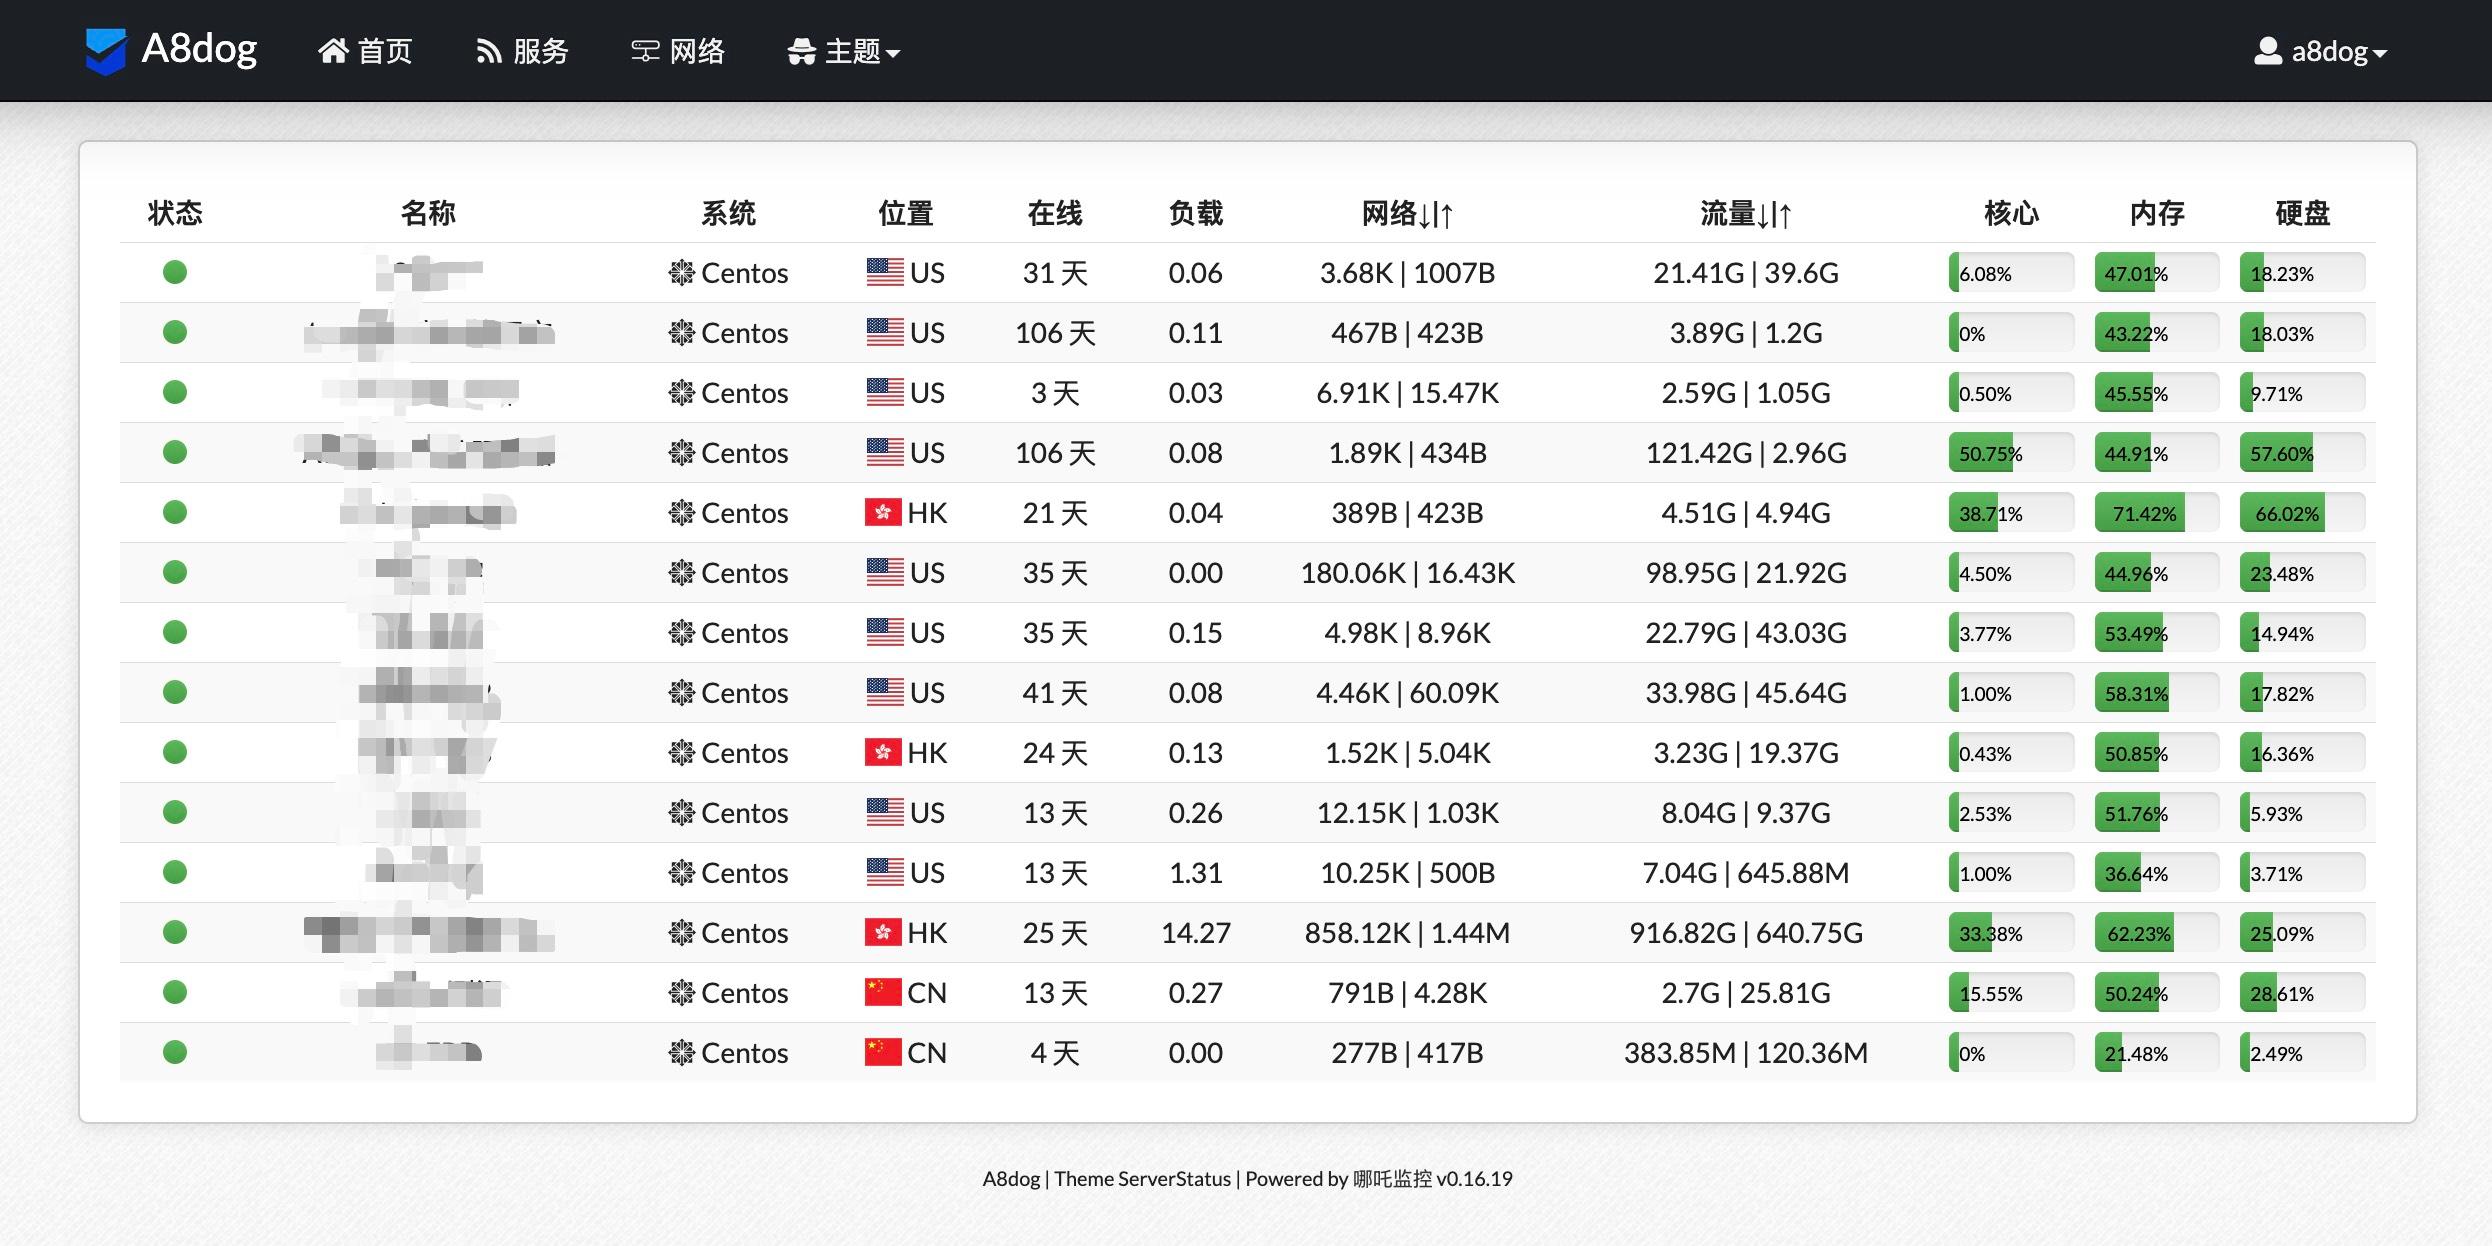
Now I still have a dozen or so chicks, and recently I hung up the Nezha probe and it feels great for no reason.
Last year, I bought a few junk chicks from CLOUDCONE, and they automatically deducted my credit card at the beginning of this year. Since it was an annual fee, I had to use them, but fortunately, I am now using them.
The online time is relatively new, and I like to reinstall the system before using it.
Setup Tutorial:#
Nezha Probe Official Documentation: https://nezha.wiki/
GitHub: https://github.com/naiba/nezha
Prepare a VPS chick as the panel side, and prepare several VPS chicks as the monitoring side.
Parse two domain names to the panel side, one can be used as the panel side access with CDN, and the other cannot be used as the communication side (using the server IP is also possible), CDN needs to support the WebSocket protocol.
Prepare nginx reverse proxy for domain name access, and it is also possible to use the Baota panel as a reverse proxy.
Setting up the panel side#
Obtain the Client ID and Secret Key from GitHub
Because Nezha Monitor integrates with GitHub, Gitlab, and Gitee as backend administrator accounts, we need to create a third-party login application.
Here we use GitHub as an example (first open the GitHub page to log in):
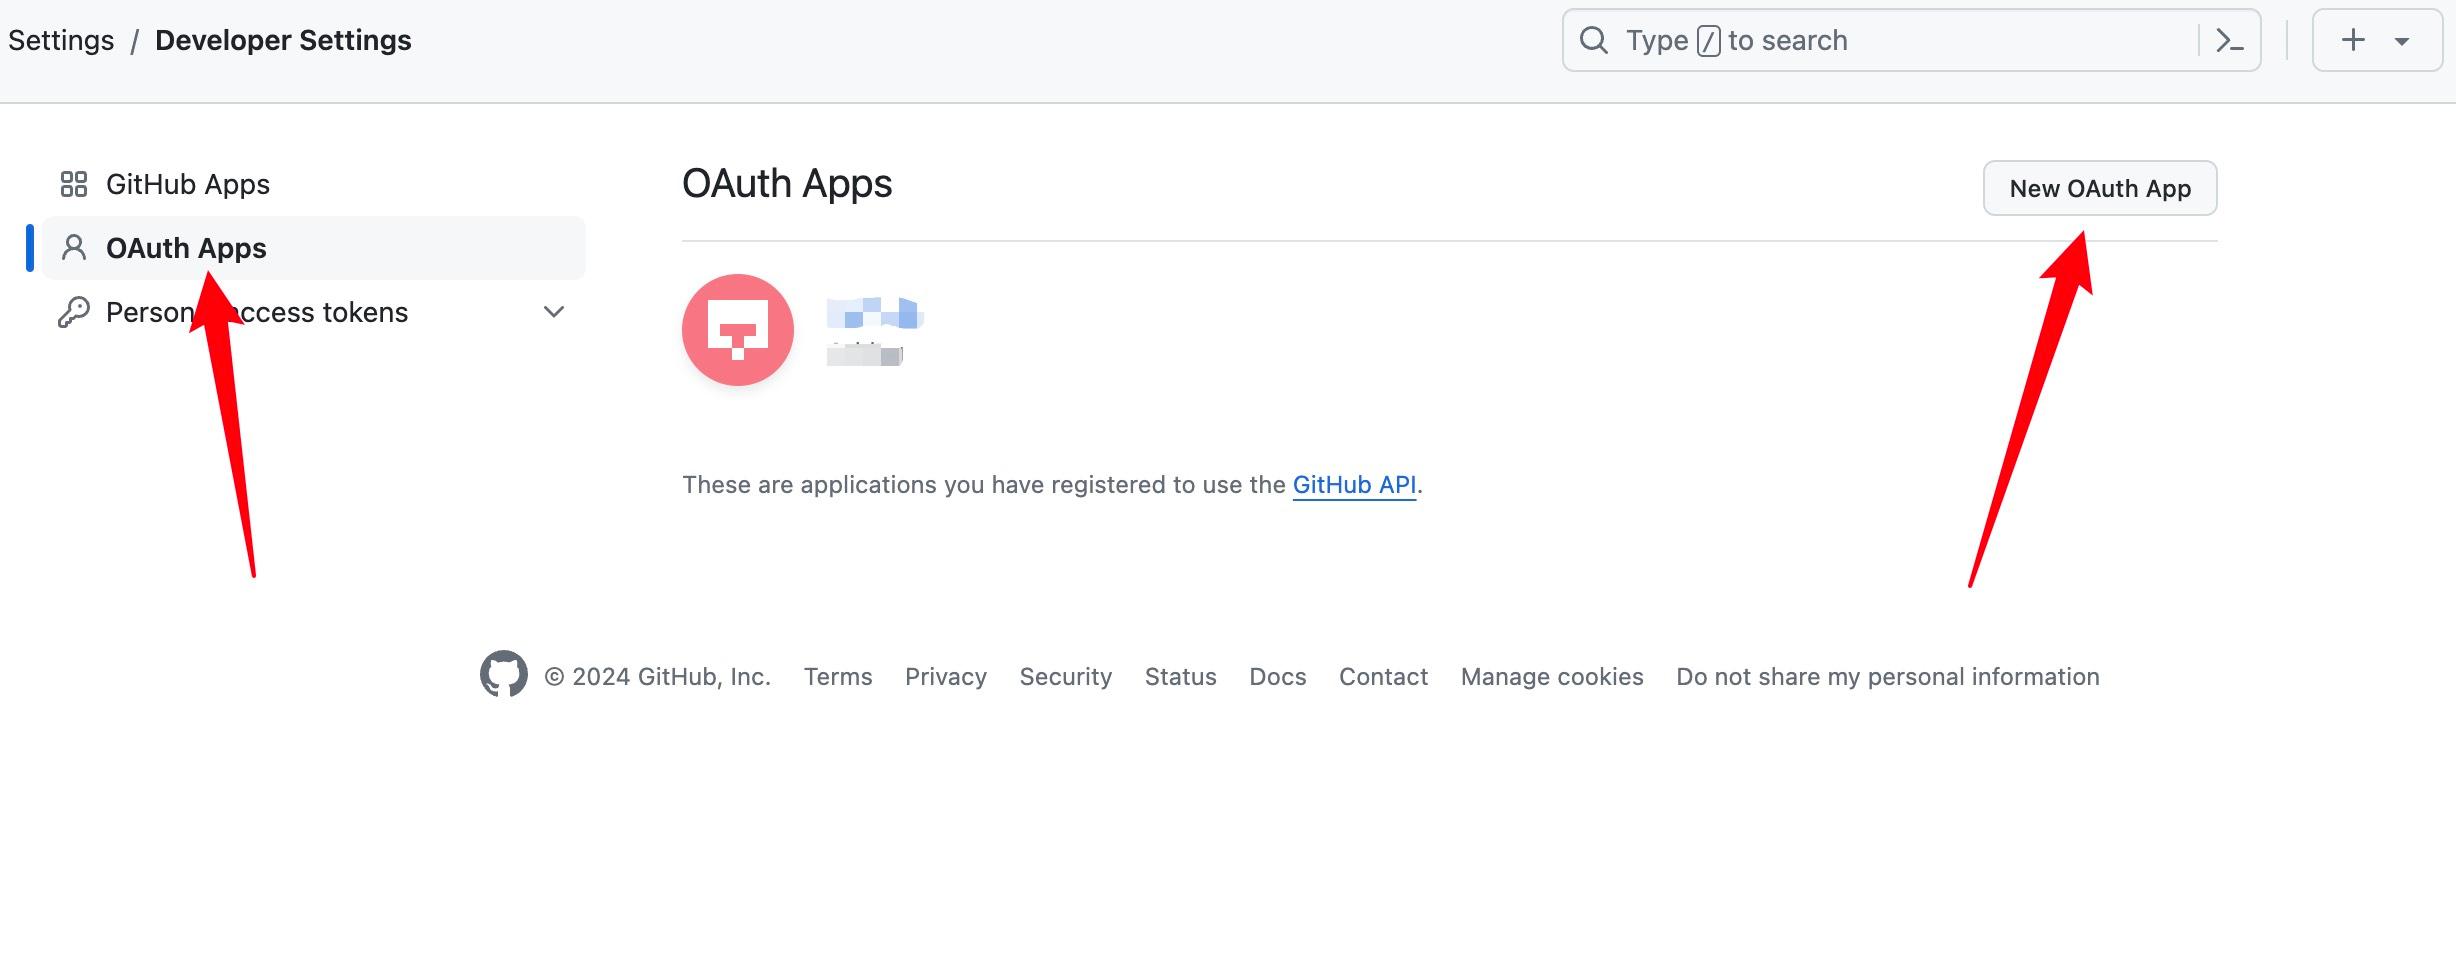
Then open: https://github.com/settings/developers and select "OAuth Apps" - "New OAuth App" in order.
Application name - Fill in randomly
Homepage URL - Fill in the access domain name of the panel
For example: "http://cdn.example.com" (your domain name)
Authorization callback URL - Fill in the callback address
For example: "http://cdn.example.com/oauth2/callback" (don't forget /oauth2/callback)
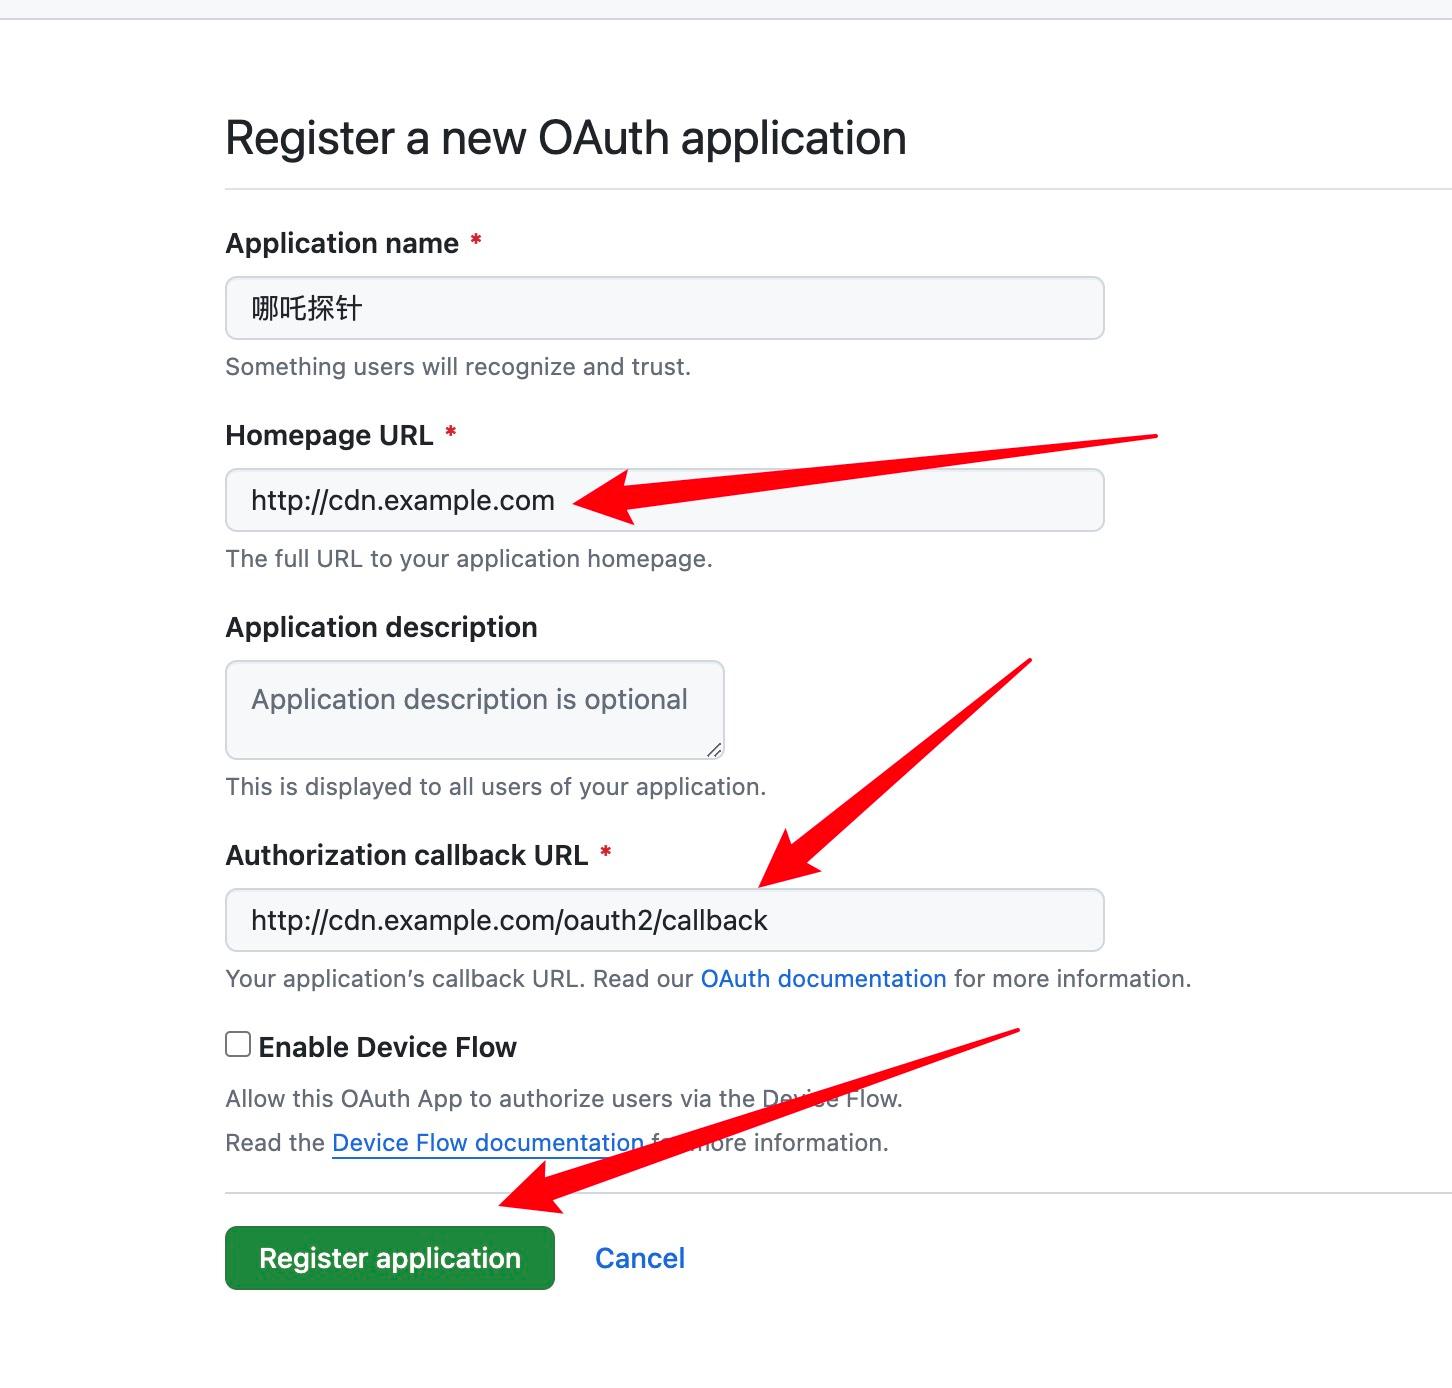
Click "Register application"
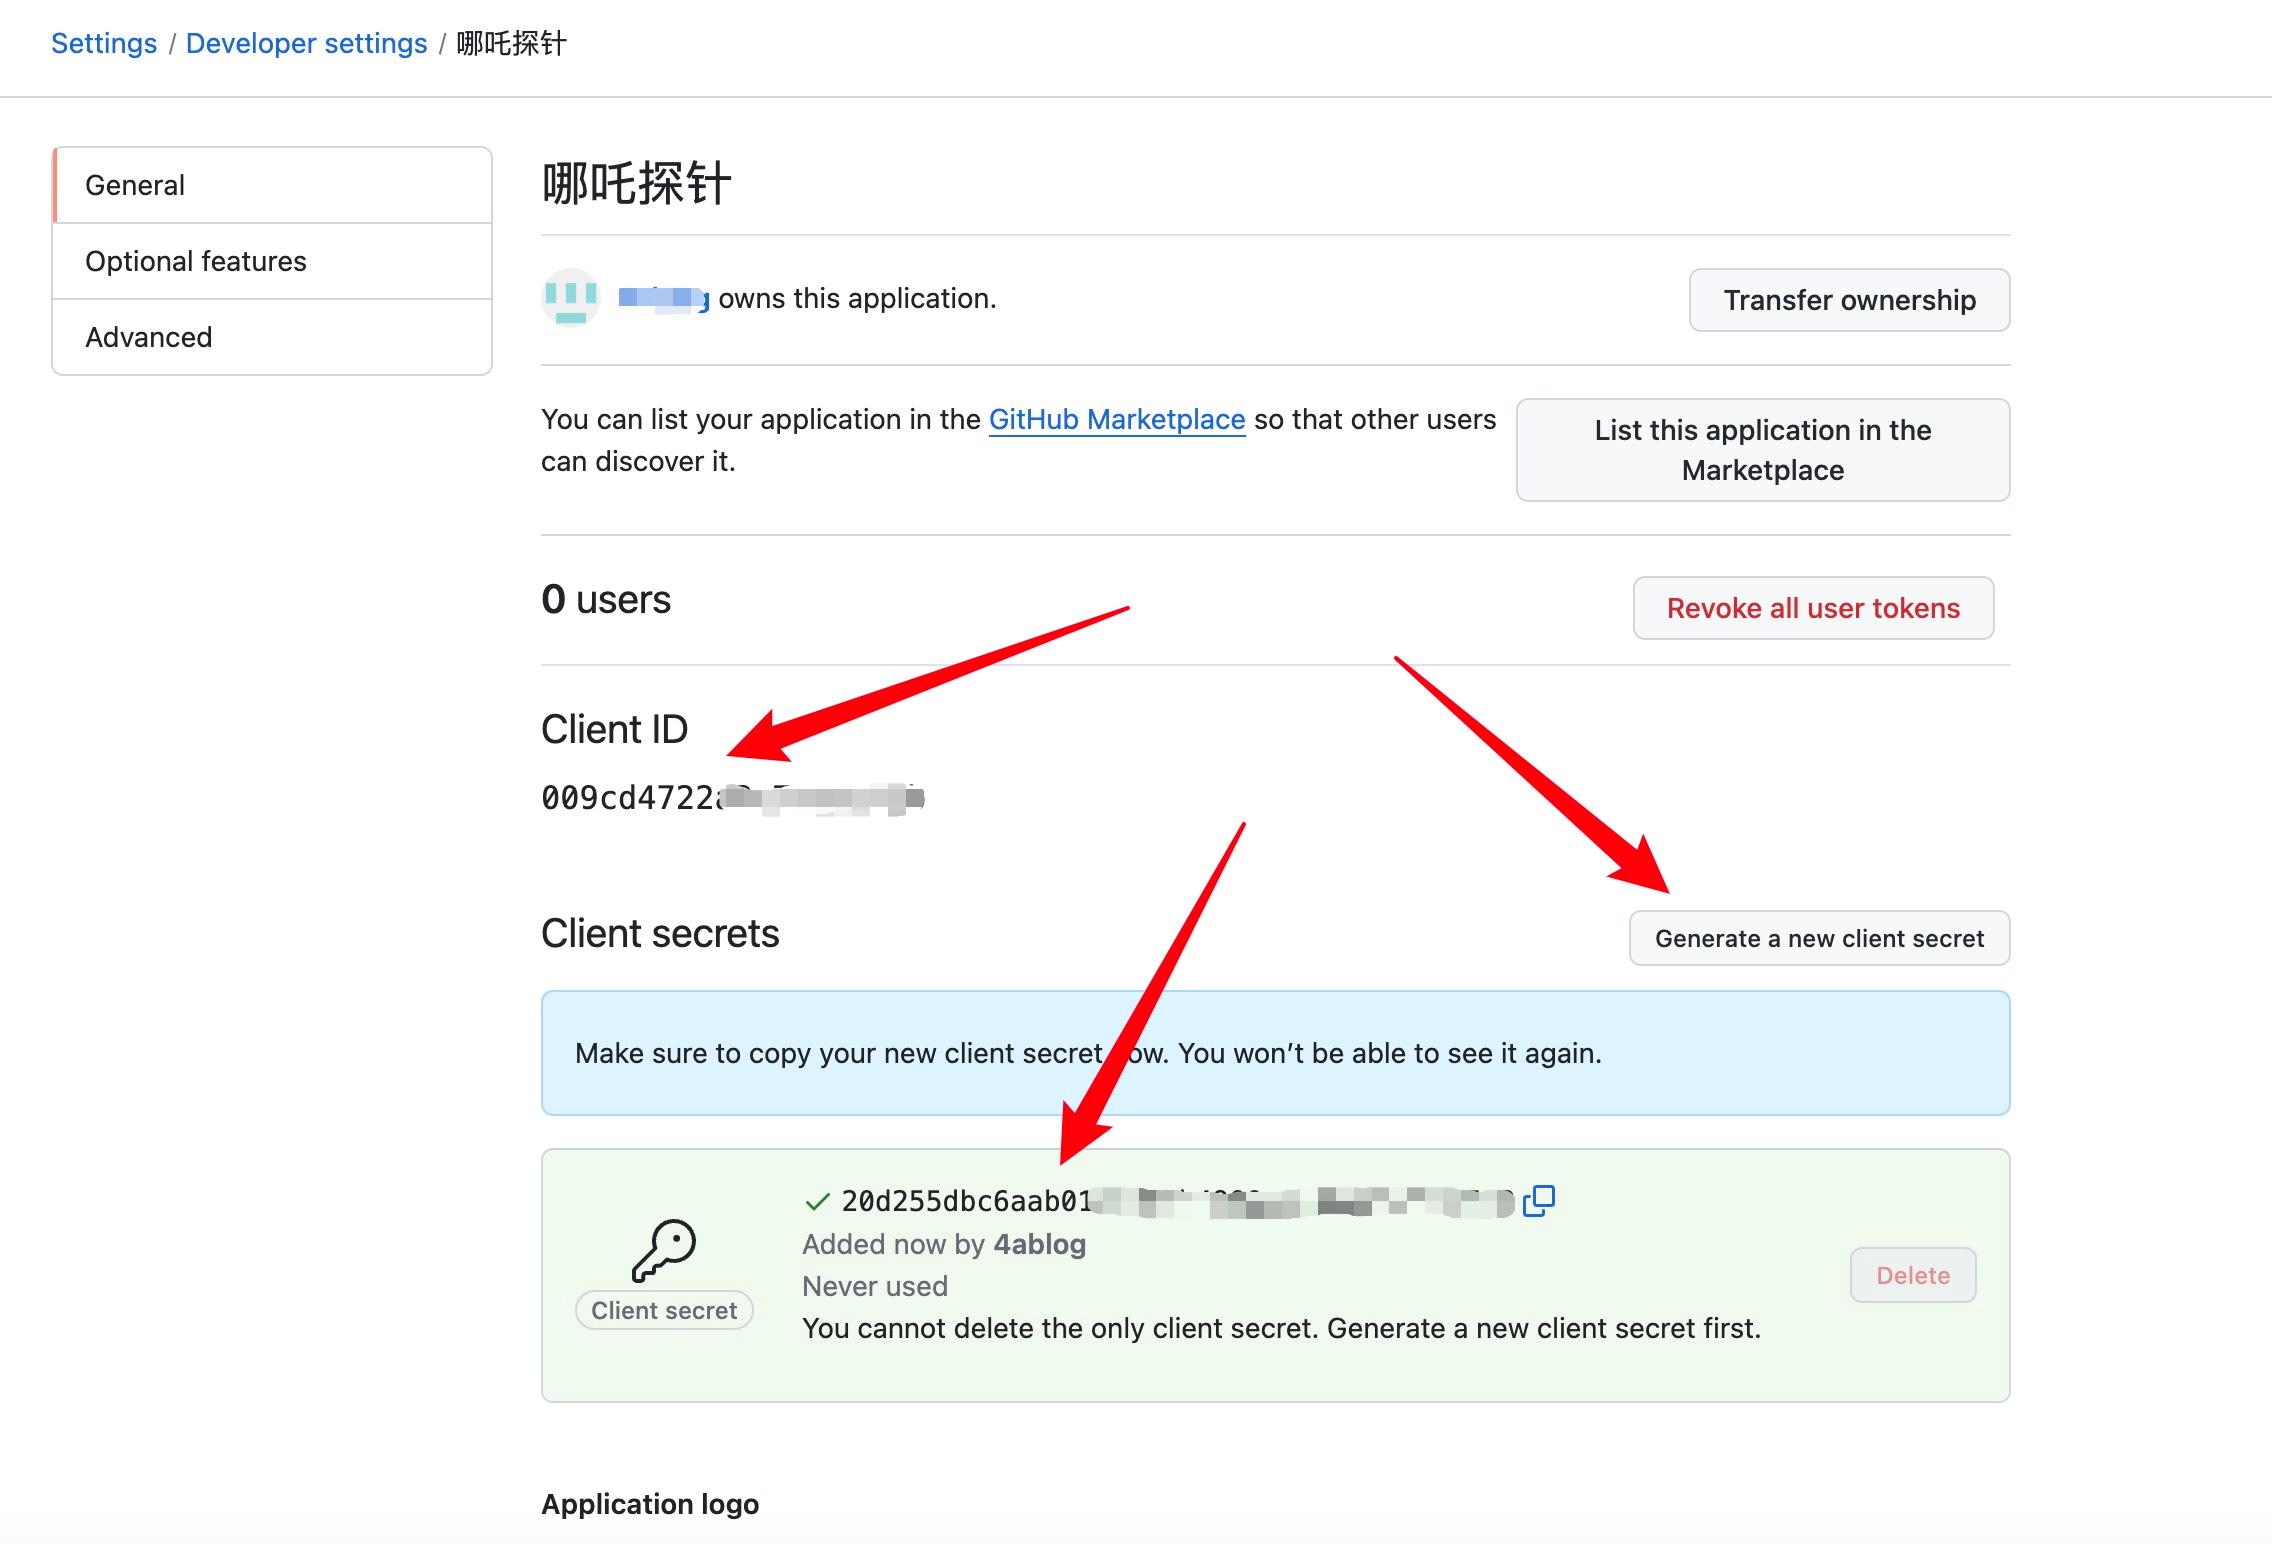
Save the Client ID on the page, and then click "Generate a new client secret" to create a new Client Secret. The newly created secret will only be displayed once, so please keep it safe. Please refer to the following figure:
Install the panel side on the server#
On the panel server, run the installation script:
curl -L https://raw.githubusercontent.com/naiba/nezha/master/script/install.sh -o nezha.sh && chmod +x nezha.sh && sudo ./nezha.sh
If your panel server is located in mainland China, you can use the mirror:
curl -L https://gitee.com/naibahq/nezha/raw/master/script/install.sh -o nezha.sh && chmod +x nezha.sh && sudo CN=true ./nezha.sh
-
After Docker is installed, enter the following values one by one:
-
OAuth provider - Choose one from GitHub, Gitlab, and Gitee
-
Client ID - Client ID saved earlier
-
Client Secret - The secret key saved earlier
-
Username - Username in the OAuth provider
-
Site title - Custom site title
-
Access port - Public access port, customizable, default is 8008
-
Agent communication port - Communication port between Agent and Dashboard, default is 5555
-
After entering the values, wait for the image to be pulled
-
After the installation is complete, if everything is normal, you can access the panel by using the domain name + port number, such as "http://cdn.example.com:8008"
-
If you need to run the script again in the future, you can run:
./nezha.sh
to open the management script.
Configure reverse proxy
Create a new site in the Baota panel, fill in the domain name as the public access domain name, such as "http://cdn.example.com", and then click "Settings" to enter the site settings options, select "Reverse Proxy" - "Create Reverse Proxy"
Customize a proxy name, fill in http://127.0.0.1 in the "Target URL" below, and then click "Save"
Open the configuration file on the right side of the newly created reverse proxy, and replace the configuration file with the following content:
#PROXY-START/
location / {
    proxy_pass http://127.0.0.1:8008;
    proxy_set_header Host $http_host;
    proxy_set_header      Upgrade $http_upgrade;
}
location ~ ^/(ws|terminal/.+)$  {
    proxy_pass http://127.0.0.1:8008;
    proxy_http_version 1.1;
    proxy_set_header Upgrade $http_upgrade;
    proxy_set_header Connection "Upgrade";
    proxy_set_header Host $http_host;
}
#PROXY-END/
Click "Save" and now you should be able to directly access the panel using the domain name, such as: "http://cdn.example.com".
Setting up the monitoring side#
Currently, Nezha Monitor supports one-click installation of the Agent on Windows and Linux, making it easy to deploy on servers.
Preparation#
You need to set up the communication domain name in the management panel in advance. This domain name cannot be connected to CDN. Here, we use the example communication domain name "data.example.com" for demonstration purposes.
Go to the "Settings" page in the background management panel, fill in the communication domain name in the "Panel server domain name/IP not connected to CDN" field, and then click "Save".
One-click installation on Linux (Ubuntu, Debian, CentOS)#
First, add a server in the management panel
Click the green Linux icon button next to the newly added server, and copy the one-click installation command
Run the copied one-click installation command on the controlled server, and wait for the installation to complete, then return to the Dashboard homepage to see if the server is online.
One-click installation on Windows#
First, add a server in the management panel
Click the green Windows icon button next to the newly added server, and copy the one-click installation command
Enter the Windows server and run PowerShell. In PowerShell, run the copied installation command
If you encounter a confirmation of "execution policy change", select Y
Wait for the installation to complete, then return to the Dashboard homepage to see if the server is online
Installing the Agent (monitoring side) in other ways#
Installation on Linux
First, add a server in the management panel
On the controlled server, run the script (for servers located in mainland China, please use the mirror):
curl -L https://raw.githubusercontent.com/naiba/nezha/master/script/install.sh -o nezha.sh && chmod +x nezha.sh && sudo ./nezha.sh
If your controlled server is located in mainland China, you can use the mirror:
curl -L https://gitee.com/naibahq/nezha/raw/master/script/install.sh -o nezha.sh && chmod +x nezha.sh && sudo CN=true ./nezha.sh
- Select "Install monitoring Agent"
- Enter the communication domain name, such as: "data.example.com"
- Enter the panel communication port (gRPC port), default is 5555
- Enter the Agent key. The Agent key is generated when adding a server in the management panel and can be found on the "Servers" page in the management panel
- Wait for the installation to complete, then return to the Dashboard homepage to see if the server is online
Manual installation on Windows#
Please refer to the community article: Nezha Probe - Windows Client Installation
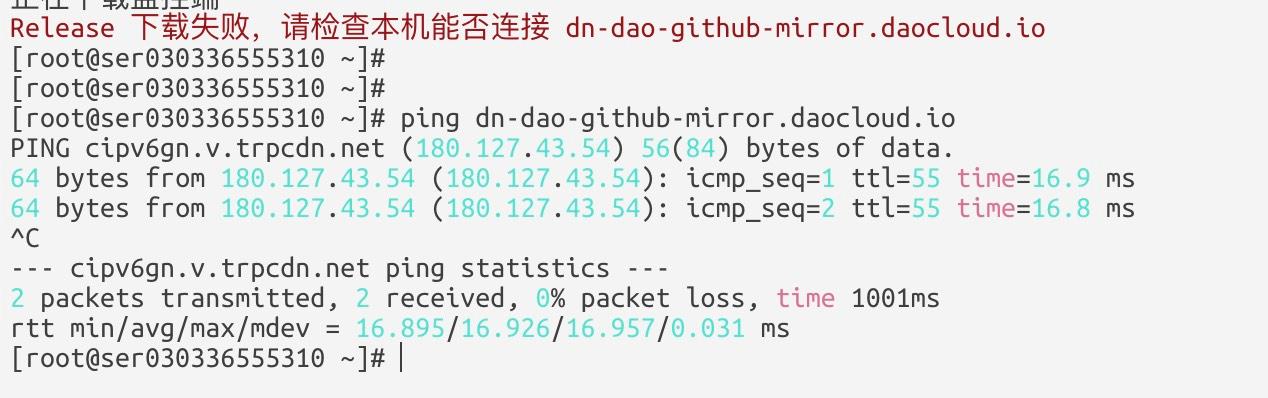
Unable to install the monitoring side in China#
If you use the official mirror script to install, you may encounter the same situation as me:
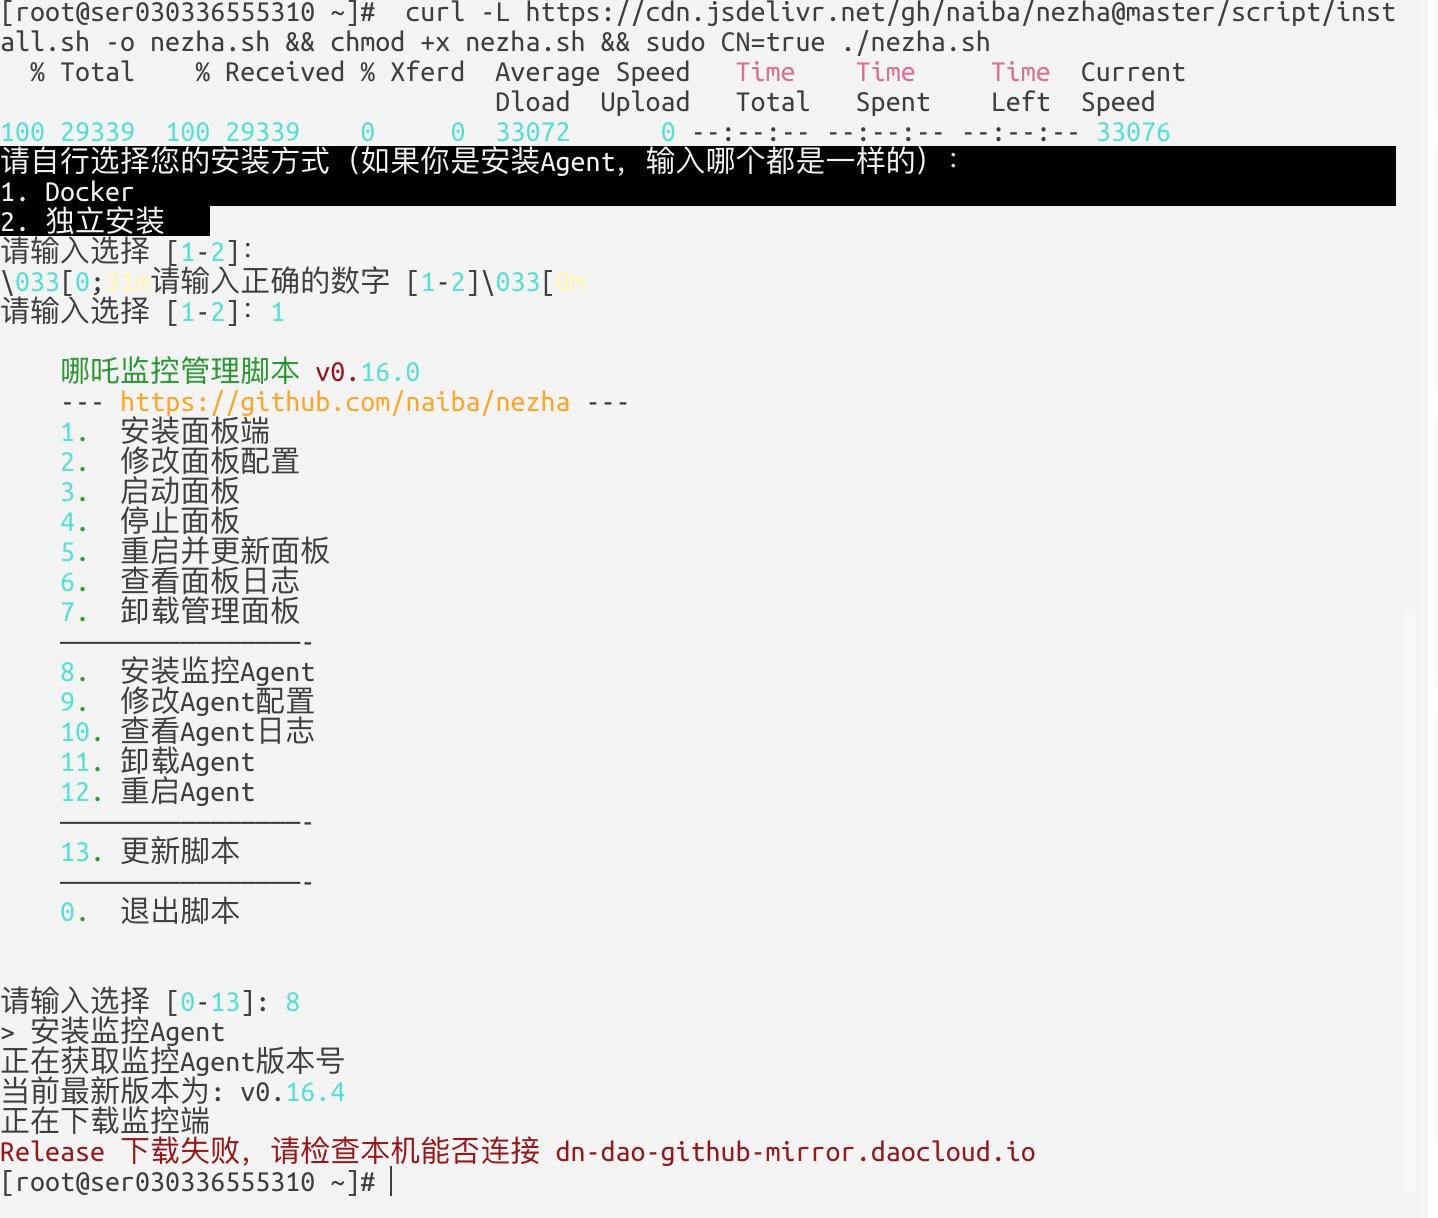
The following content is from nezha.sh
NZ_BASE_PATH="/opt/nezha"
NZ_AGENT_PATH="${NZ_BASE_PATH}/agent"
NZ_AGENT_SERVICE="/etc/systemd/system/nezha-agent.service"
- "/opt/nezha" is the storage directory for the core of the panel, including Dashboard and Agent
- "/opt/nezha/agent" combined with the previous text, this directory is the storage location of the core files of the proxy side
- "/etc/systemd/system/nezha-agent.service"
- Small partners who are familiar with Linux systems will know that this file determines the startup of the Nezha proxy side
Steps#
Please download nezha-agent from https://api.github.com/repos/nezhahq/agent/releases/latest, choose the compressed package of your system version, and extract it locally. There will be a binary file.
Create the "/opt/nezha/agent" directory on the server, place nezha-agent in it, and then execute:
chmod +x nezha-agent
Create a "nezha-agent.service" file in the "/etc/systemd/system/" directory, replace the code below, and save it:
[Unit]
Description=Nezha Agent
After=syslog.target
#After=network.target
#After=nezha-dashboard.service

[Service]
# Modify these two values and uncomment them if you have
# repos with lots of files and get an HTTP error 500 because
# of that
###
#LimitMEMLOCK=infinity
#LimitNOFILE=65535
Type=simple
User=root
Group=root
WorkingDirectory=/opt/nezha/agent/
ExecStart=/opt/nezha/agent/nezha-agent -s 1.1.1.1:5555 -p 密钥
Restart=always
#Environment=DEBUG=true

# Some distributions may not support these hardening directives. If you cannot start the service due
# to an unknown option, comment out the ones not supported by your version of systemd.
#ProtectSystem=full
#PrivateDevices=yes
#PrivateTmp=yes
#NoNewPrivileges=true

[Install]
WantedBy=multi-user.target
Replace 1.1.1.1:5555 and 密钥 with your own, and finally execute the following command:
systemctl daemon-reload
systemctl enable nezha-agent
systemctl restart nezha-agent
Finally, refresh the background of the Nezha probe to see the chick online.